
E-bikes have swiftly surged in popularity across the United States, revolutionizing the landscape of urban commuting and recreational cycling. With varying levels of motor assistance, e-bikes provide versatility, catering to a wide spectrum of users, from casual riders to commuters seeking a more sustainable and accessible alternative to traditional bikes or cars.
The U.S. market has witnessed a remarkable expansion in e-bike adoption, fueled by technological advancements, improved infrastructure, and a growing emphasis on green mobility solutions.
As e-bike usage surges across the U.S., concerns regarding safety and accidents have emerged with their popularity. Reports of e-bike accidents have risen, paralleling the increase in their adoption.
Factors contributing to these incidents vary, including collisions with motor vehicles, inadequate infrastructure, rider inexperience, and issues related to speed management. With e-bikes capable of higher speeds than traditional bicycles, accidents involving these electrically assisted vehicles often result in more severe injuries, raising concerns about rider safety and road-sharing dynamics.
E-Bike Accident Statistics
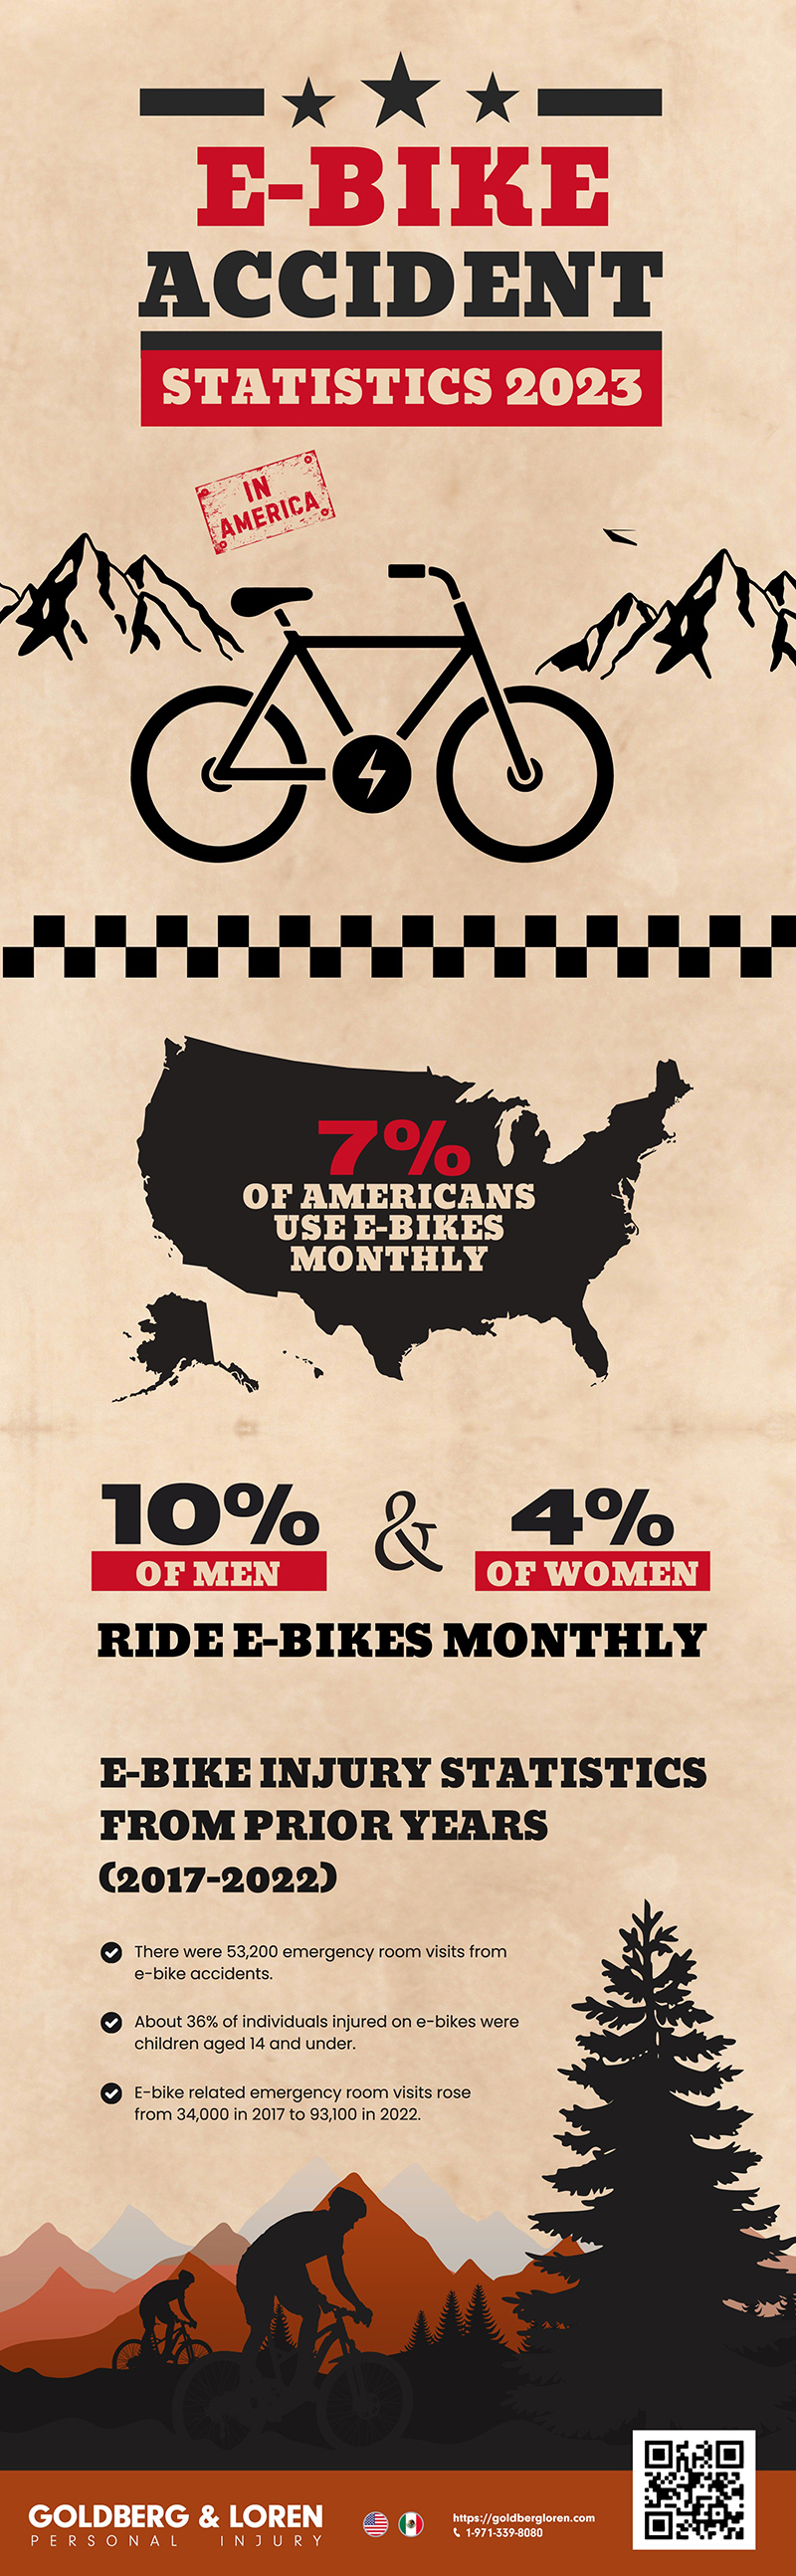
- Approximately 7% of Americans use an e-bike monthly. [1]
- Monthly, 10% of men and 4% of women in the U.S. ride e-bikes. [1]
- The estimate of emergency department visits from e-bike accidents from 2017 to 2022 is 53,200, representing 15 percent of the total micromobility injury estimate during the same period. [2]
- The estimate of emergency department visits from electric scooter accidents from 2017 to 2022 is 169,300, representing 17 percent of the total micromobility injury estimate during the same period. [2]
- Research indicates that the increase in injuries linked to micromobility devices is almost 21% from 2021 to 2022. Since 2017, micromobility-related injuries have risen, with an estimated average annual growth of 23%. [2]
- Children 14 years old and younger accounted for 36% of the injured. [2]
- The micromobility-related emergency department visits rose significantly from 34,000 in 2017 to 93,100 in 2022. [2]
- In 2022 alone, almost half (46%) of all estimated e-bike injuries from 2017 to 2022 took place. [2]
- The fatalities from e-bike accidents are 104 from 2017 to 2022, whereas the fatalities from e-scooter accidents account for 111 for the same period. [2]
- Fire hazards, brake problems, and product-related issues were the most common reasons for the accidents. [2]

Factors Contributing to E-Bike Accidents
Electric bikes, or electric bicycles, have become increasingly popular as a mode of transportation due to their convenience and eco-friendly nature. The rise in e-bike use has also led to an increase in e-bike risks. Various factors contribute to e-bike accidents, ranging from rider behavior to infrastructure issues.
Here are some of the key factors that contribute to e-bike accidents:
- Speed variance: Electric bicycles can reach higher speeds (20-28 miles per hour) than regular bicycles. It leads to issues when sharing roads or paths where speed differentials between e-bikes and other vehicles or cyclists may cause collisions.
- Fire hazards: Although e-bikes have become increasingly popular, concerns have arisen regarding fire hazards associated with lithium-ion batteries. In recent years, there have been reports of e-bike accidents caused by battery fires, posing a risk to riders and bystanders.
- Inadequate infrastructure: Insufficient or poorly designed infrastructure, such as a lack of dedicated bike lanes or poorly maintained roads, increases the risk of accidents for e-bike riders, especially in areas with heavy traffic.
- Collision with motor vehicles: Accidents involving e-bikes and motor vehicles often occur due to limited visibility of e-bike riders by drivers or failure to anticipate the speed or maneuverability of e-bikes.
- Rider inexperience or error: Inexperience handling an e-bike or improper use of its features, such as sudden acceleration or braking, can lead to loss of control and accidents.
- Equipment malfunction or maintenance: Issues related to the malfunctioning of e-bike components or inadequate maintenance can compromise the bike’s safety, increasing the risk of injury.
Where are E-Bike Accidents Most Commonly Reported in the U.S.?
According to recent data, California, Florida, Texas, Louisiana, and Arizona are the top 5 states with the highest incidences of e-bike accidents. [3] These states have high populations, which increases the likelihood of e-bike usage and subsequent bicycle accidents.
Factors such as traffic congestion, lack of designated e-bike lanes, and inexperience with e-bike handling contribute to the high accident rates in these states.
Each of these states has regulations and initiatives in place to promote e-bike safety. For instance, California recently passed a law requiring electric bicycle riders under 18 to wear helmets.
New York has implemented bike lanes to improve safety for e-bike users, mitigate the risks associated with e-bike accidents, and improve overall road safety.

Prevention Tips for Riding an E-Bike Safely
Riding an e-bike can be a fun and convenient way to get around, but it’s essential to prioritize safety.
Here are the top 5 e-bike safety tips
- Protect your head in accidents by wearing a properly fitted bicycle helmet.
- Obey traffic laws, including stopping at red lights and yielding to pedestrians.
- Stick to designated bike lanes whenever possible to separate yourself from car traffic.
- Stay alert and keep an eye out for other vehicles, pedestrians, and potential hazards on the road.
- Regularly check the brakes, tires, and other essential components to ensure your e-bike is in good working condition.
Contact Goldberg & Loren today for legal guidance if you’ve been involved in an e-bike accident.
E-Bike Accident Statistics 2023 Infographic
Sources:
[1] Racing the demographics of e-bike owners in the US. (n.d.). https://business.yougov.com/content/44110-tracing-demographics-e-bike-owners-us
[2] Micromobility Products-Related Deaths, Injuries, and Hazard Patterns: 2017–2022. (2023). United States Consumer Product Safety Commission. Retrieved December 29, 2023, from https://www.cpsc.gov/s3fs-public/Micromobility-Products-Related-Deaths-Injuries-and-Hazard-Patterns-2017-2022.pdf
[3] Smith, H. (2023, July 6). The Most Dangerous Places for Cyclists. Velotric. https://www.velotricbike.com/blogs/story-landing/the-most-dangerous-places-for-cyclists
