In This Article

How Many Car Accidents Happen in Oregon Each Year?
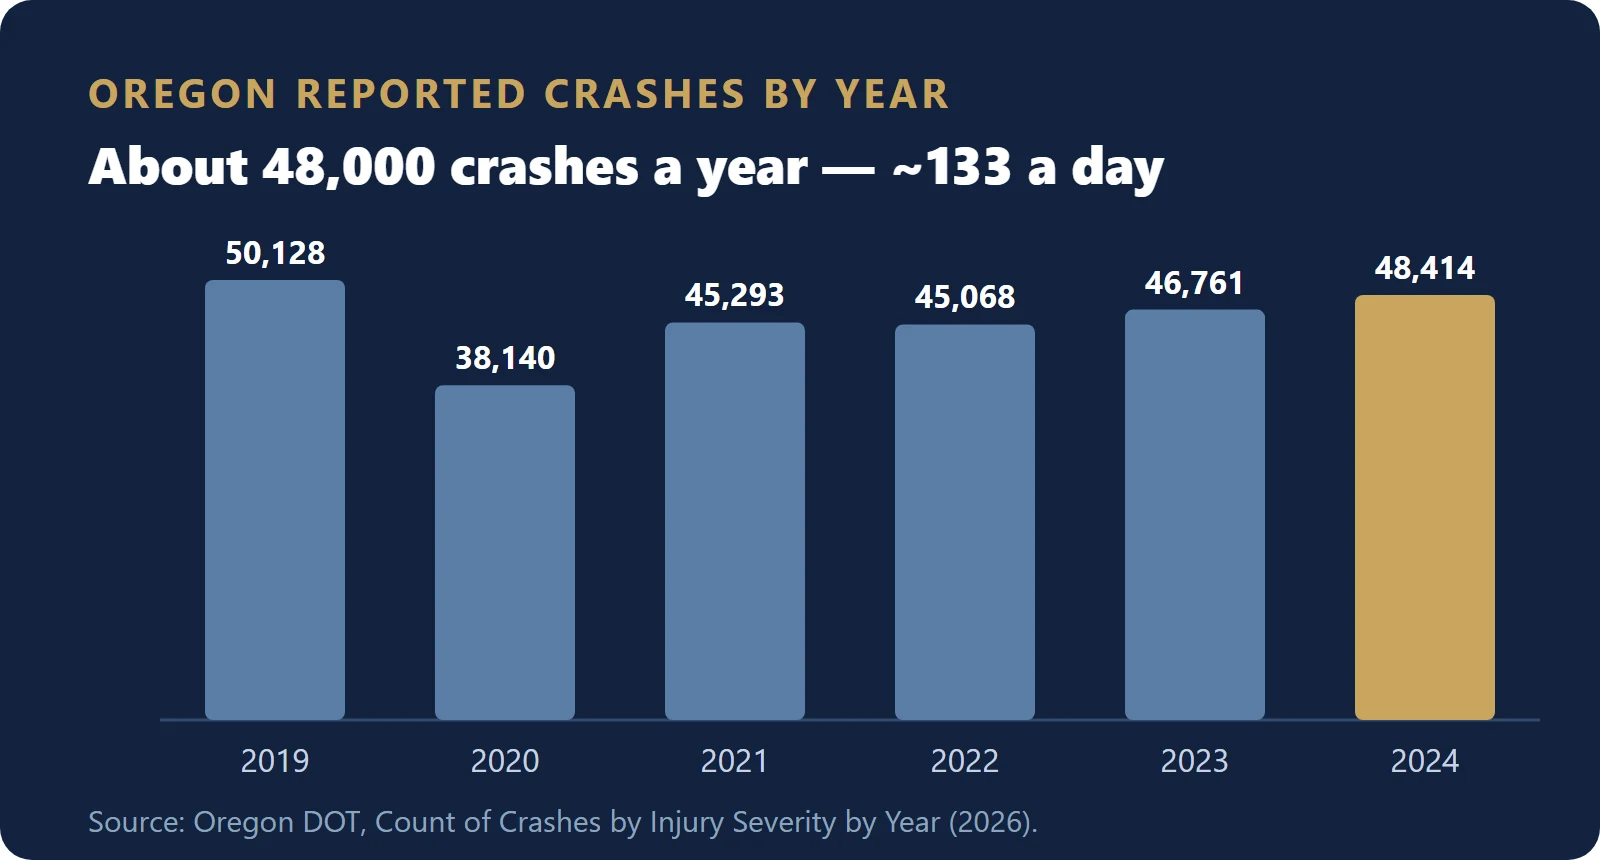
Oregon logged 48,414 reported crashes in 2024, up from 45,293 in 2021 – roughly 133 every day. The yearly totals have climbed back above pre-pandemic levels after a dip in 2020.
How Many People Die in Oregon Crashes?
Traffic deaths rose sharply earlier this decade and have started to ease: 599 in 2021, about 601 in 2022, 587 in 2023, and 538 in 2024. For long-term context, Oregon recorded roughly 317 deaths in 2010, so deaths nearly doubled to their 2022 peak before declining.
Is Oregon’s Crash Death Rate Higher Than the National Average?
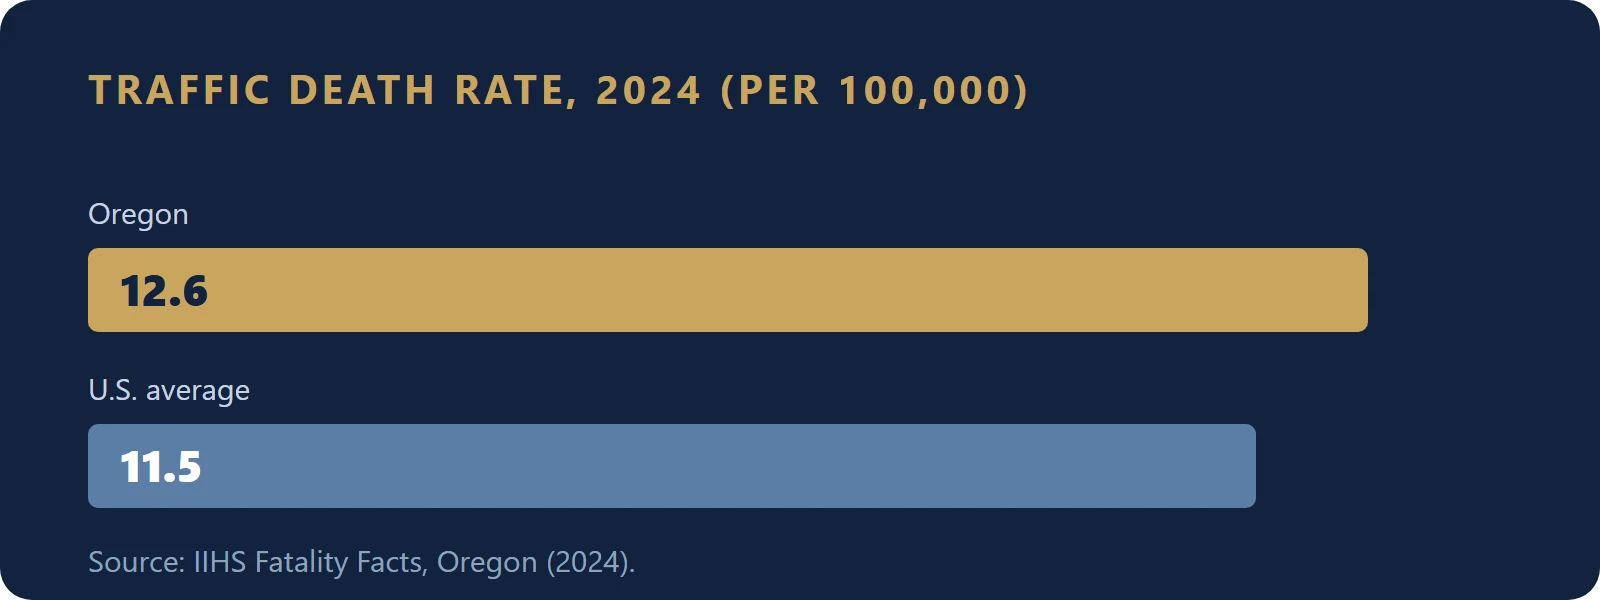
Yes. Oregon’s 12.6 traffic deaths per 100,000 people in 2024 is above the U.S. average of 11.5.
Who Is Most at Risk?
Young people remain over-represented: about 3,483 people ages 15–19 were injured in Oregon crashes in 2021. Speed, distracted driving, and impairment are the factors most often tied to Oregon’s worst crashes.
Frequently Asked Questions
About 48,414 reported crashes in 2024 (roughly 133 per day), up from 45,293 in 2021. (Oregon DOT.)
599 in 2021, about 601 in 2022, 587 in 2023, and 538 in 2024. (Oregon DOT / IIHS.)
Yes – 12.6 deaths per 100,000 people in 2024 versus the U.S. average of 11.5. (IIHS Fatality Facts, 2024.)
Oregon DOT ties the largest recent increases to speed, distracted driving, and young drivers.
Yes. Under Oregon’s modified comparative negligence rule you can recover if you are 50% or less at fault (ORS 31.600), and PIP covers up to $15,000 in medical bills for two years (ORS 742.524).
Generally two years from the crash for injury claims (ORS 12.110); three years for wrongful death (ORS 30.020).
Injured in an Oregon crash? Our Portland car accident attorneys can review your case for free. Call (971) 339-8080 or request a free consultation.
Sources
[1] Oregon DOT, Crash Analysis & Reporting Unit — Count of Crashes by Injury Severity by Year. oregon.gov/odot
[2] Oregon DOT — State of the System / annual fatalities. oregon.gov/odot
[3] IIHS — Fatality Facts, Oregon (2024). iihs.org
Figures from Oregon DOT and IIHS (2019–2024). Last updated September 2026. General information, not legal advice.
Our Car Accident Service Areas
Where We Handle Car Accident Cases in Oregon
Goldberg & Loren's car accident lawyers help people injured in crashes throughout Oregon. If you were hurt in a wreck in one of these communities, connect with a local car accident lawyer: